Deriving π In the Kitchen
Recently, I've been chatting with Delphine & Alina about some potential explorations/experiments we might be able to do at home regarding math. Specifically, how people figured out some of the very basic, foundational ideas (e.g.: how to measure the circumference of the Earth and how to derive the value of π).
I started researching how to calculate π at home and found an experiment you can do in your house. It involves throwing frozen hot dogs across your kitchen and counting how many times they cross parallel lines that you've draw on your floor.
Check this out: Calculate PI Using Frozen Hot Dogs.
This is peculiar indeed. Notice a couple of things:
- It doesn't matter how long the object is you use. It could be a pencil, a hot dog, or a frozen otter pop.
- It doesn't matter how many lines you draw on the floor. Theoretically, you could do this with a minimum of three. The Wiki page says "6-10 strips".
I thought to myself: How does this work?[1]
Since it was really bugging me, I decided to try to figure out the underlying mathematics. This diagram is the first one I drew:
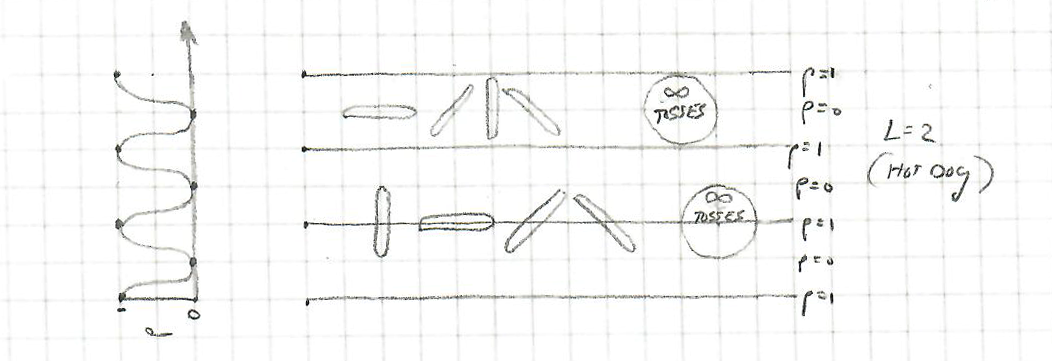
It shows a hot dog of length = 2, with 4 parallel lines drawn on the kitchen floor. The first four tosses are "not a cross" (the hot dog lands right in the middle). The next four tosses are "always a cross" (these land right on one of the parallel lines). The two circles represent "an infinite number of tosses" (one never crossing, one always crossing).
You can see the probability of a given toss being a cross as indicated by "p". p=1 is a cross, p=0 is not. I graphed this on the left-hand side, so it shows the probability of a cross relative to each parallel line.
The next diagram is the "otter pop" toss:
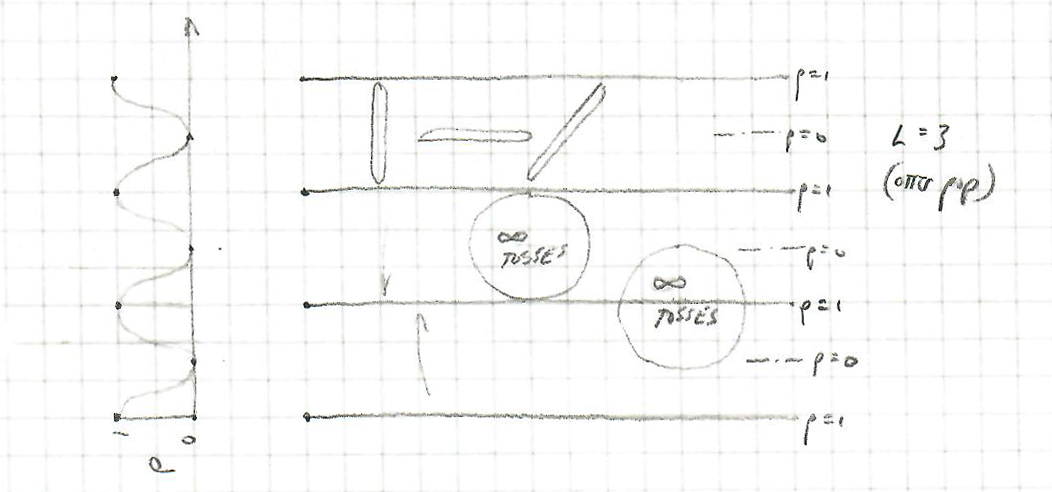
This shows an otter pop of length = 3, also with 4 parallel lines. There are three tosses (not a cross) ... then the two "infinite number of tosses" circles are added. The same probability (of a cross) is shown on the left.
My conclusion was: Length doesn't matter. The derivation involves a ratio of some kind:
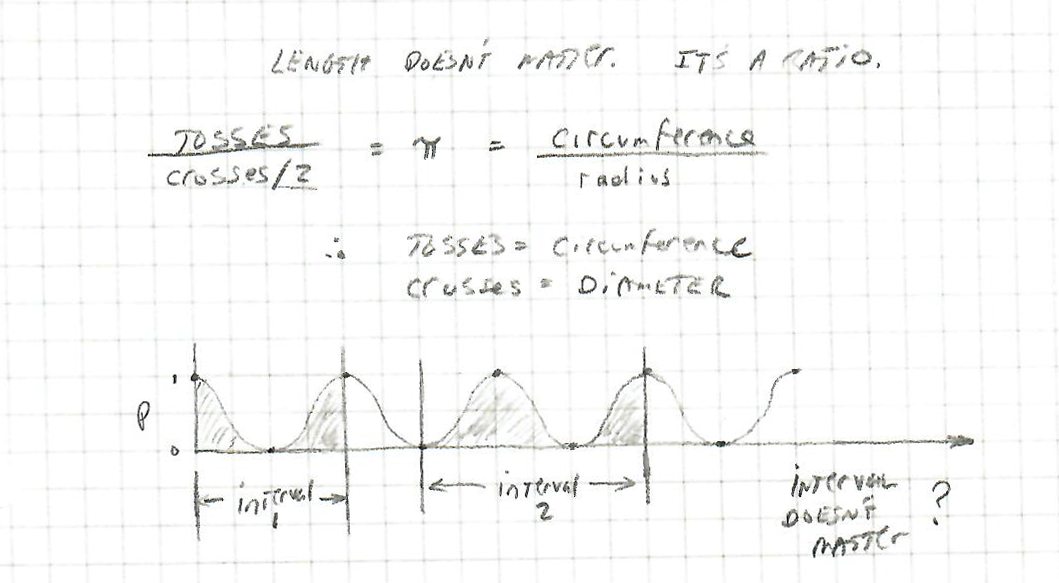
In backing up to the classical definition of π:
Since this experiment uses:
...then "tosses" must indicate circumference and "crosses" must be diameter (so "crosses/2" is radius").
This will eventually turn out to be entirely tangential/unrelated (meaning, tosses and crosses are only related in a very abstract way, kind of like how all people are similar because they all breathe air).
Also note, on that 3rd image (directly above), the question arises as to whether the interval matters. Meaning, you could have had 4 parallel lines on your kitchen floor, or 7, or 12 .. it can't matter in the end .. which means the interval we choose is likely to involve the area around a single parallel line (said another way: "normalized around a single line").
The next diagram is just a graph of sin(x) with amplitude 1. It's our "probability of a cross" curve:
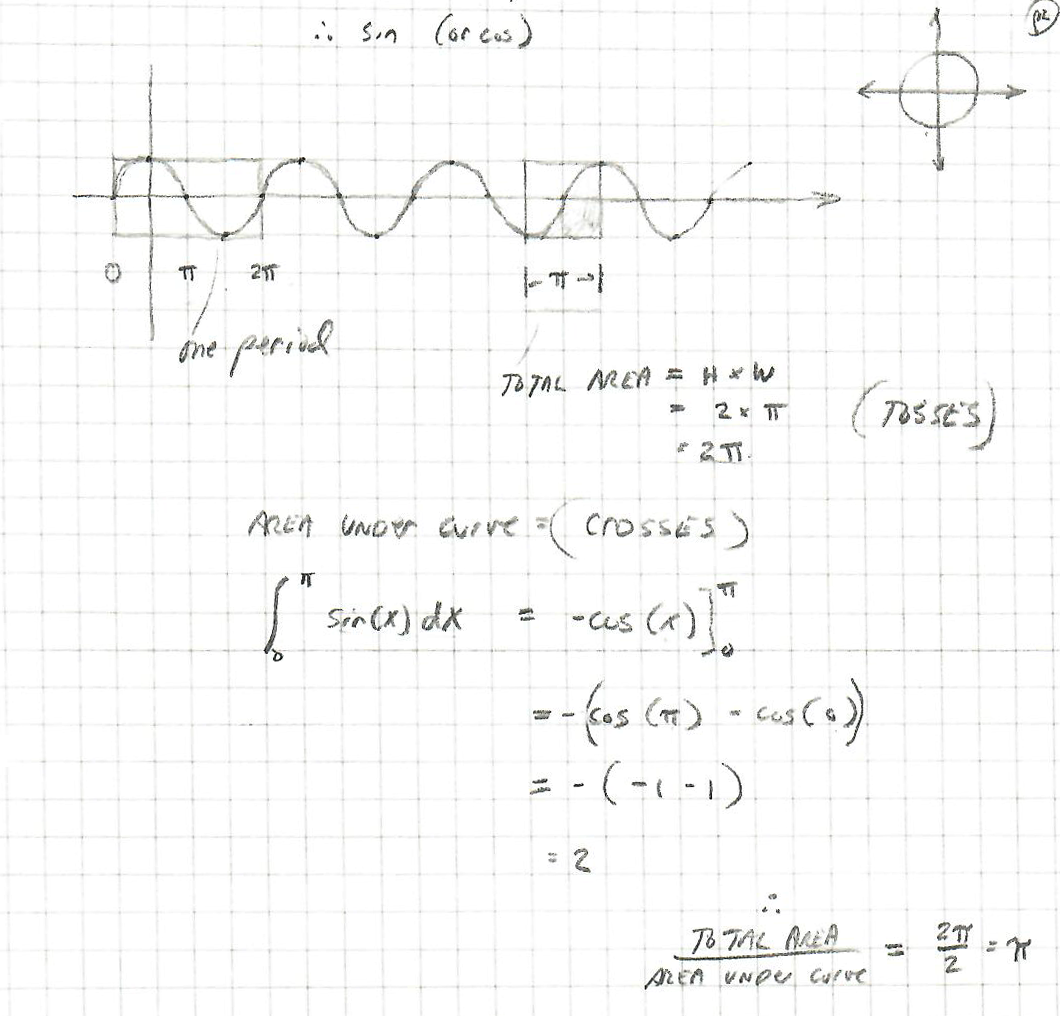
Here are my two assumptions:
- The total area (HxW) of an area represents "all tosses".
- The area under the sin curve represents "all crosses".
Therefore, if we calculate both of these and take the ratio, we should get something related to π.
I could be wrong on the 2nd assumption (I actually think it "crosses x 2", because the cross can happen above or below the center line (between two parallel lines), so you end up with a sort of mirrored number of crosses, if that makes sense). Said another way: crosses are doubly represented because they can happen above or below a p=0 centerline.
Why does the area underneath the curve show crosses? Go back to my original 2 diagrams, the ones with the "infinite number of tosses" circles. Take one of these that's centered on "p=0" and slide it up or down across the parallel lines. You can see that the probability of a cross increases or decreases as the circle slides. The area underneath the "Probability of a Cross" graph shows all crosses.
To calculate the area under the curve, we use calculus: it's just the integral of sin(x)dx from 0 to π. When you're done with that (the value is "2"), divide the total area "2π" by the area under the curve "2", and you end up with π.
I chose an initial interval of π, so my total area is 2π and the area under the sin(x) curve is 2, giving me a ratio of π
So far, so good, yes?
My question is: where did the 2 go? (the "(crosses/2)" two).
Shouldn't it be the case that I divide the area under the curve by 2 before I compute my ratio? (total area ÷ area under the sin(x) curve?)
These last three diagrams may not be necessary ... but they were somewhat helpful to me.
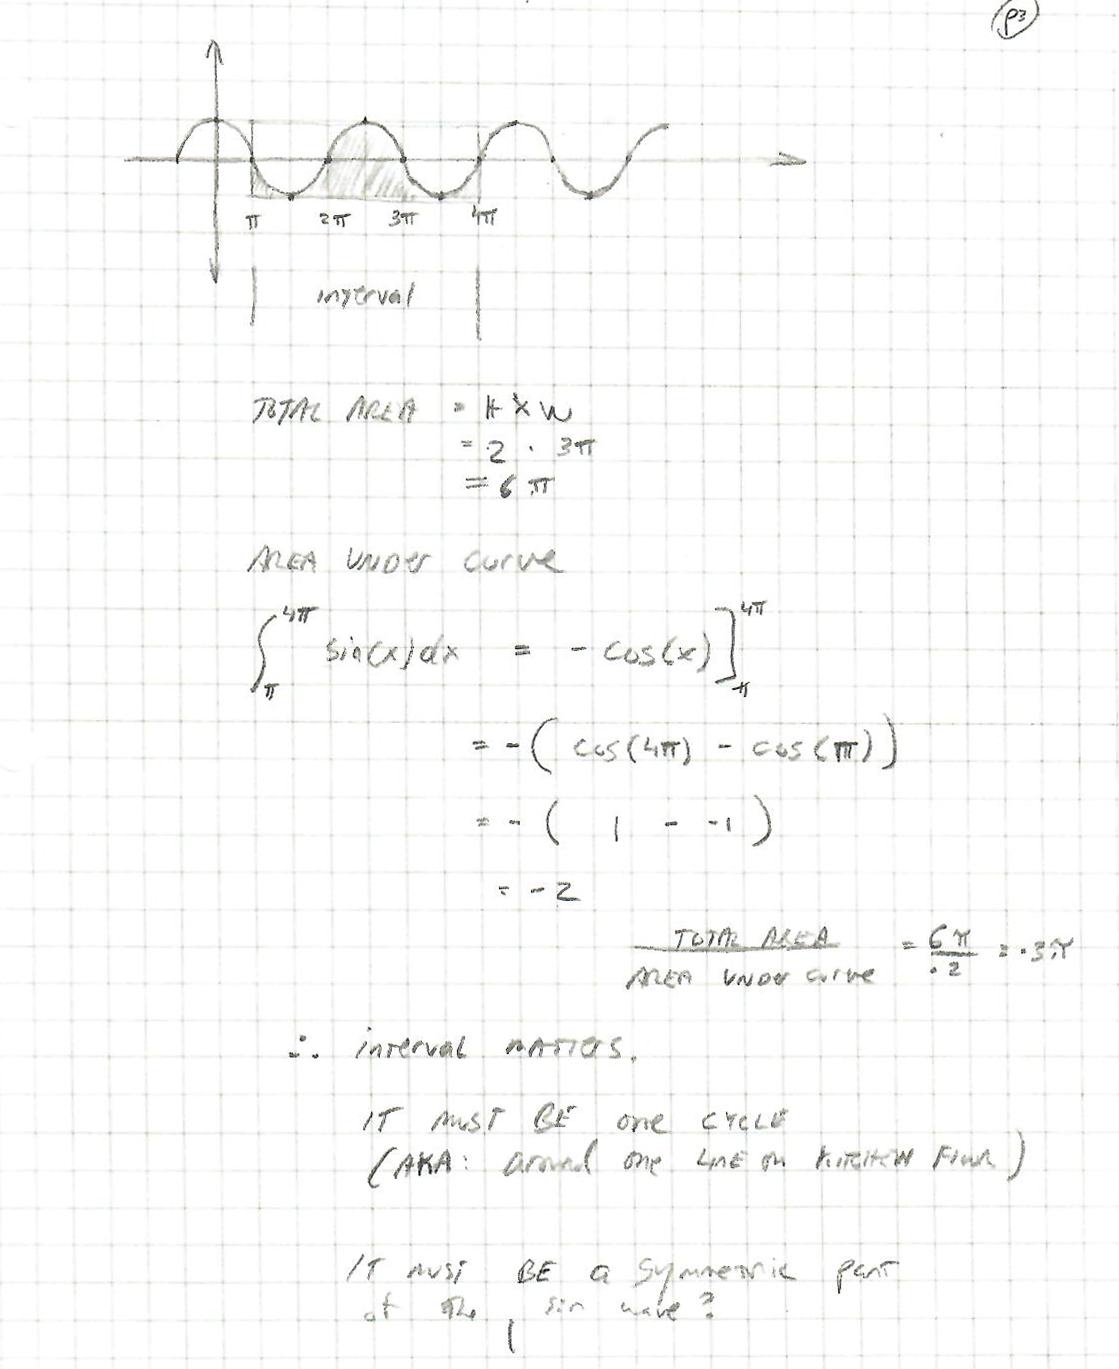
The next diagram shows that a larger interval doesn't work. This supports my assumption that the whole calculation needs to be normalized against a single parallel line (so the interval is fixed). In this case, I chose an interval of 3π and my ratio turned out wacky (-3π). (I have a sign error in there)
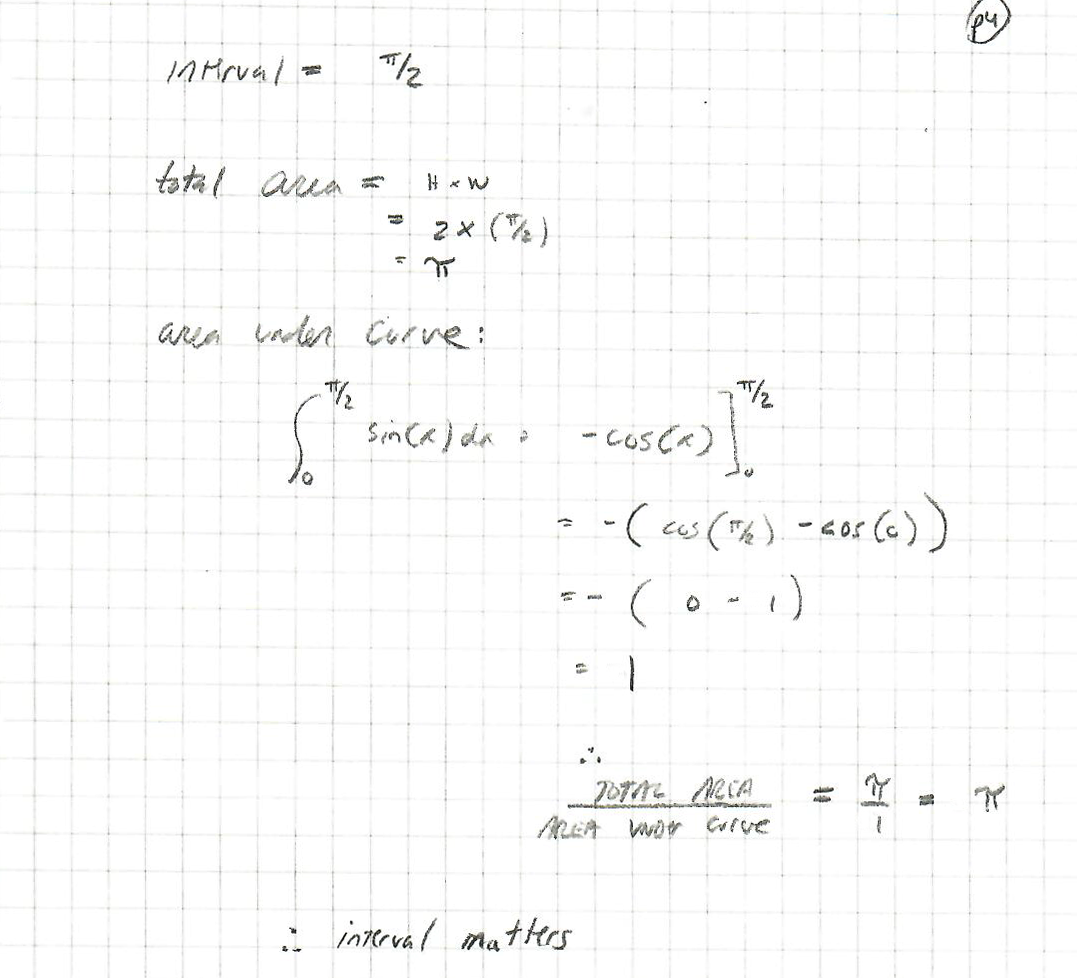
The next diagram shows that an interval of π/2 might work (though I still have my "where did the missing 2 go?" problem):
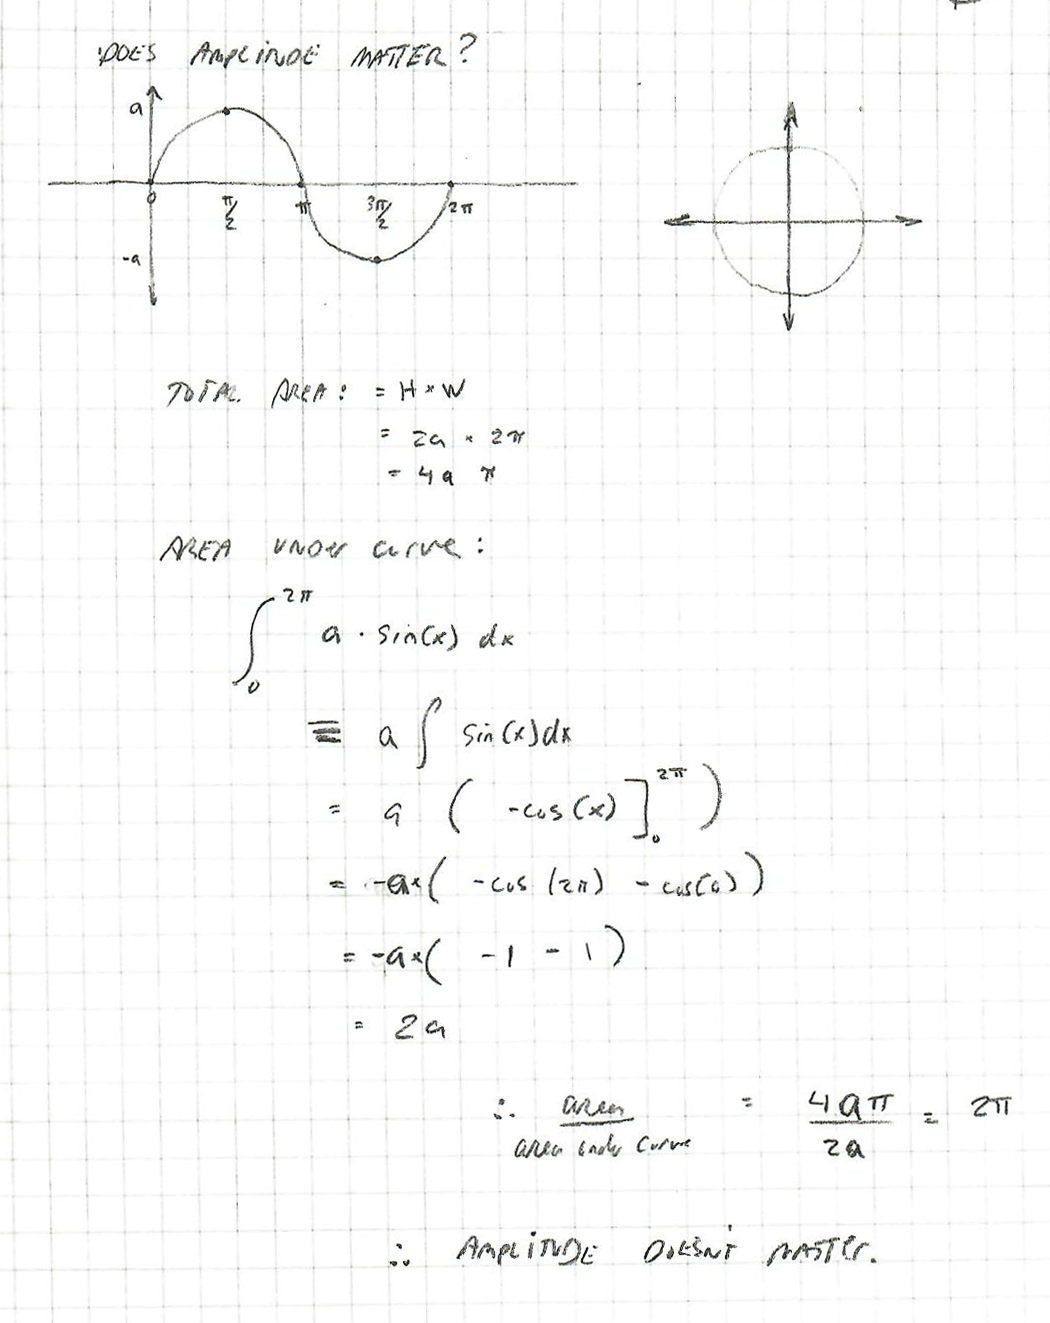
The next diagram is an attempt to show that amplitude doesn't matter. I chose "1" as the amplitude of my probability curve at the beginning, and in the case below, I chose "a":
Buffon’s needle is one of the oldest problems in geometric probability. First stated in 1777 by Georges-Louis Leclerc, Comte de Buffon*, it involves dropping a needle onto a series of parallel lines (often described as a collection of parallel wooden floor boards). A remarkable outcome of this analysis is that the probabilities involved are directly related to Pi.
At some point I'll include more from that article, once I figure out how close I am to understanding why this experiment works.